Pear Bud Weevil: How TreeScout Cut Crop Protection by 90%
Why treat a whole orchard block for pear bud weevil when the pest only sits in a few spots? At Vogelaar Fruitcultures, TreeScout mapped a pear orchard tree by tree. As a result, the grower only applied crop protection where it was really needed: roughly a tenth of the block.
Pear bud weevil: an increasing problem in pear orchards
The pear bud weevil (Anthonomus pyri) is a small weevil that lays its eggs in pear flower buds in autumn. Then, in spring, the larva hollows out the bud from the inside. As a result, the bud never opens. Instead, it stays on the tree, brown and dried out. However, you hardly ever see the weevil itself. In addition, the damage only becomes visible when it is too late. The weevil also tends to cluster in hotspots instead of spreading evenly across a block. So if you treat the entire block, you also treat large areas without any weevils.
From blossom map to prescription map in three steps
The principle is simple. A tree with pear bud weevil carries less blossom than its neighbours. Therefore, if you know the blossom of every tree, you also know where the hotspots are.
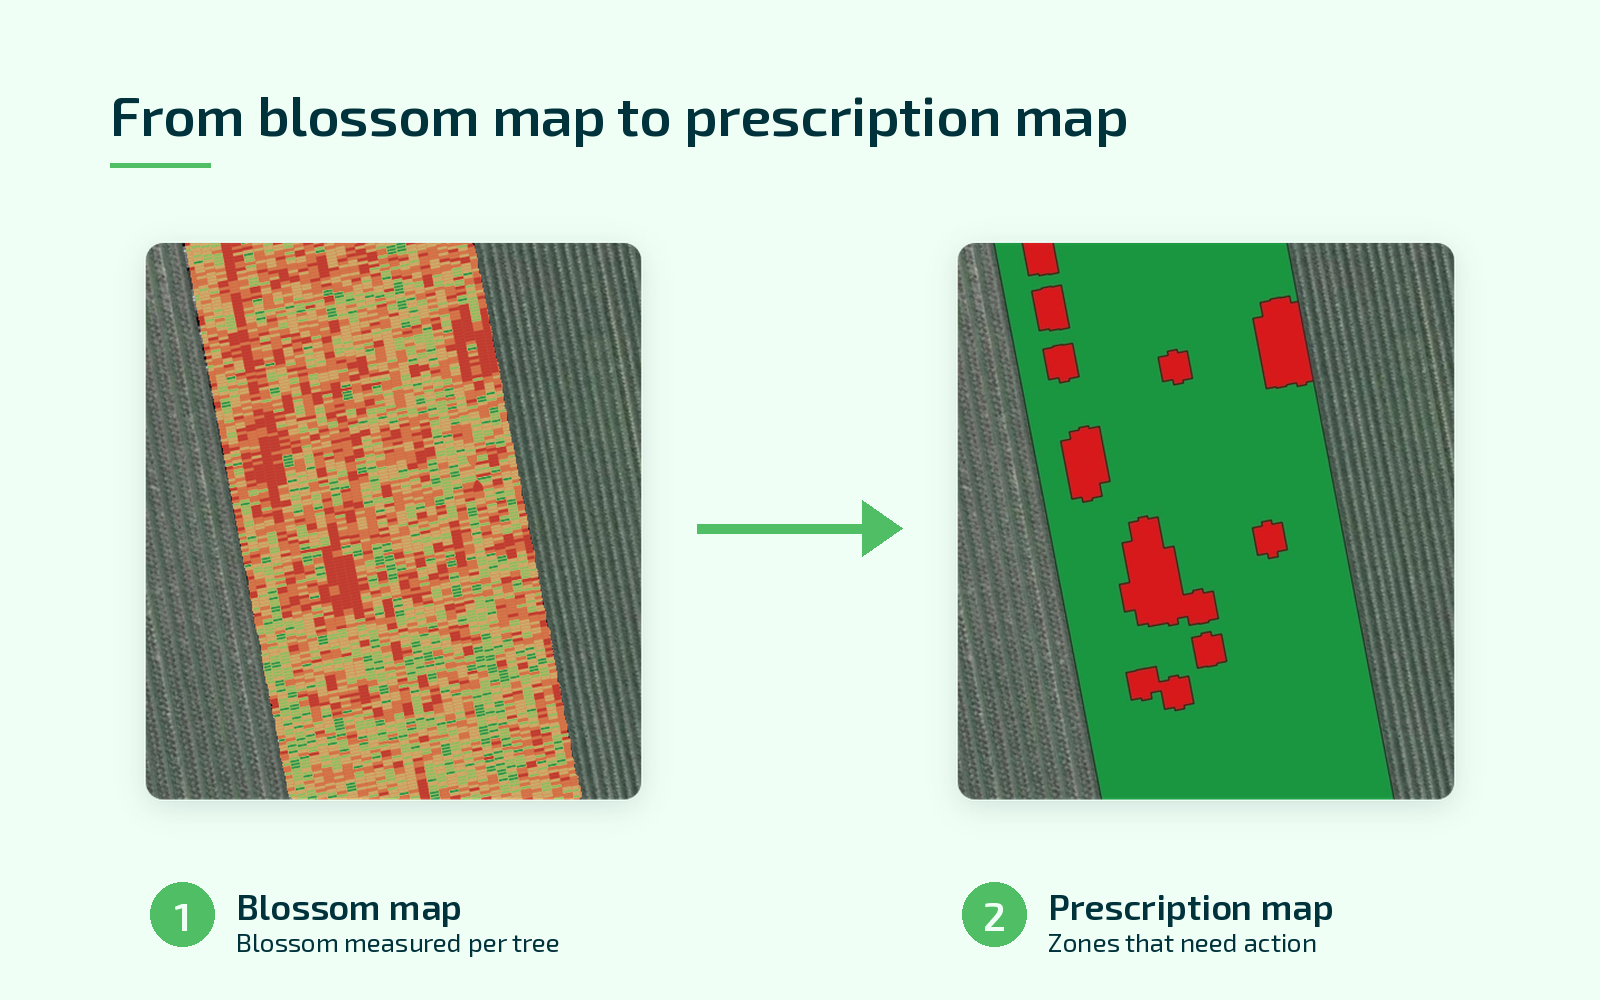
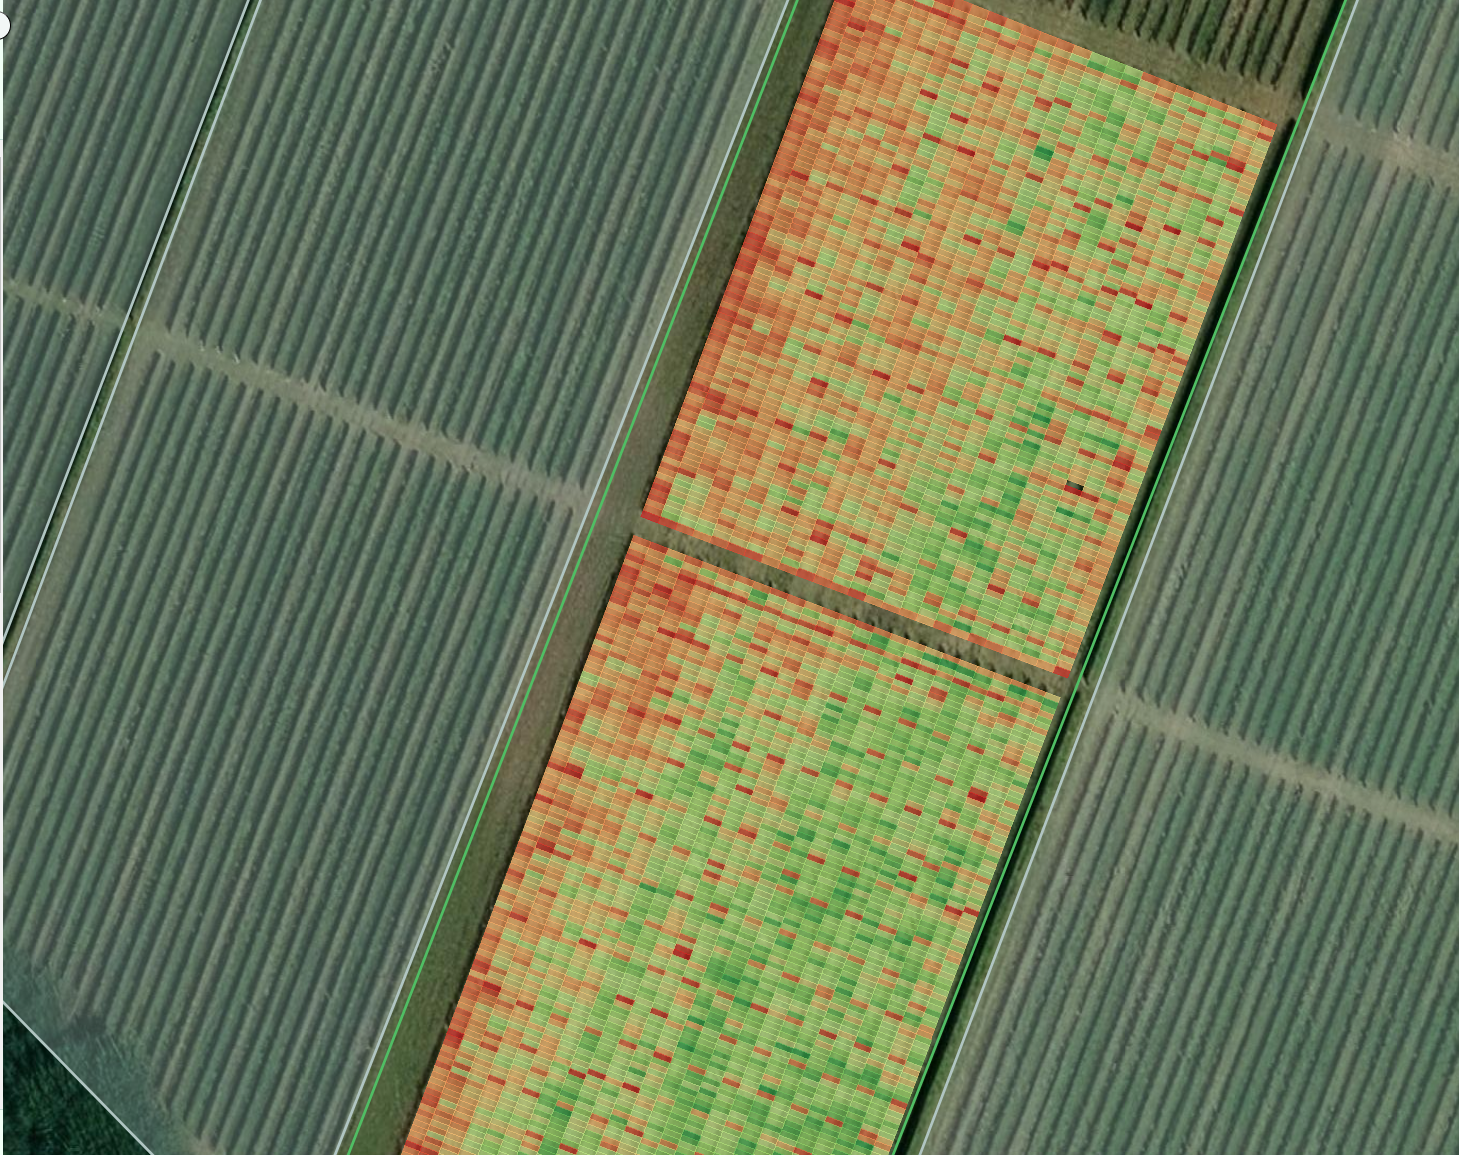
- Blossom map. First, TreeScout measures the blossom percentage of every tree during flowering in April. The result is a map that instantly shows which trees lag behind.
- Threshold and clusters. Next, every tree below a threshold counts as suspect. This threshold is a percentage of the highest blossom in the block. In this case, we chose 25%. We then filter out isolated trees, because low blossom on a single tree may have another cause. Finally, we add a buffer zone around each cluster to include its direct surroundings.
- Prescription map. After that, TreeScout turns the clusters into a prescription map. The terminal in the tractor reads this map directly. In the marked zones, it applies 600 litres per hectare. On the rest of the block, it applies nothing.
In the field
At the end of August, the prescription map went into the tractor. The terminal shows the treatment zones and switches the application on and off automatically. In other words, the driver simply drives the rows, while the map decides where to treat. Kubota supported the application in the field. In September, beating samples found pear bud weevils in the orchard. This confirms the core idea. The blossom map points out the spots, and field checks show that the weevil is actually there.
What it delivers
- Less crop protection: the grower treated about 10% of the block instead of 100%.
- Measured per tree: TreeScout measures the blossom of every single tree, so you don’t have to rely on a sample.
- Ready to use: the prescription map goes straight into the terminal, without manual work.
Get started
Moreover, the same blossom map that reveals pear bud weevil hotspots also feeds your yield forecast and thinning advice. Want to find out what TreeScout can do for your orchards? Get in touch with us.
Read more about
Enhancing mobile accessibility: The latest updates to the Aurea Imaging Portal

Een kort vraaggesprek met Hans Quint, Directeur bij ABEMEC & Joost Hazelhoff van Aurea over hun nieuwe partnerschap
Verder Samenwerken: GPX gaat als distributeur van Aurea’s TreeScout aan de slag!